

Customer retention metrics show how well your business keeps customers over time and how strong those relationships really are. They reveal whether customers return, how often they buy again, and how long they stay connected to your brand.
When retention drops, revenue becomes unstable, marketing costs rise, and forecasting turns unreliable. Retention metrics expose these risks early.
Many teams track revenue and traffic but ignore what happens after the first purchase. That gap hides churn, weak loyalty, and missed opportunities to improve customer experience. Customer retention metrics close that gap by turning loyalty into measurable signals.
This blog explains what customer retention metrics are, which ones matter most, how to read them correctly, and formulas with examples.
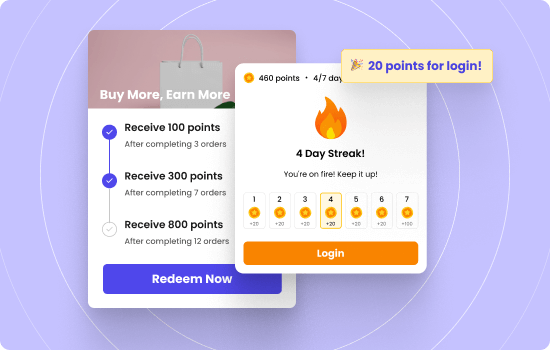
Increase your customer retention with WPLoyalty’s customized loyalty campaigns and reward your loyal customers.
What Are Customer Retention Metrics
Customer retention metrics measure how well your business keeps existing customers over a defined period. They track loyalty, repeat behavior, and long term value using metrics like Customer Retention Rate, Churn Rate, Customer Lifetime Value, and Repeat Purchase Rate, along with feedback signals such as NPS and CSAT.
Customer retention metrics help you understand:
- How many customers continue buying after their first purchase
- How often existing customers return
- How long customers stay active before leaving
- How much value retained customers generate over time
- Where customers drop off in the lifecycle
These metrics track what happens after acquisition. They show whether customers find ongoing value in your product or service, not just initial interest.
Customer retention metrics differ from acquisition metrics in one key way. Acquisition measures growth at the top, while retention measures stability at the core.
Why Customer Retention Metrics Matter More Than Acquisition Metrics
Customer retention metrics matter because they show whether your growth can last.
Below is a clean, factual table comparing retention vs acquisition,
| Aspect | Acquisition Metrics | Customer Retention Metrics |
| Focus | New customer growth | Existing customer loyalty |
| Time horizon | Short term wins | Long term stability |
| Cost impact | Higher marketing spend | Lower cost per revenue unit |
| Revenue predictability | Uncertain and volatile | More predictable and stable |
| Risk detection | Problems appear late | Problems surface early |
| Business signal | Demand generation strength | Product and experience quality |
| Growth sustainability | Fragile without retention | Strong when retention is high |
Customer retention metrics show what happens after the first purchase, where real business health lives. They reveal whether customers find enough value to stay, return, and spend again. Acquisition brings customers in, but retention decides if they stay profitable.
One stat that explains it clearly:
Research from Bain and Company shows that increasing customer retention by just 5 percent can increase profits by 25 to 95 percent, because retained customers buy more often and cost less to serve.
Core Customer Retention Metrics You Must Track
Customer retention metrics work best when you track them together, not in isolation. Each metric explains a different part of customer behavior, and missing one creates blind spots.
This section covers the most important retention metrics every business should understand and monitor.
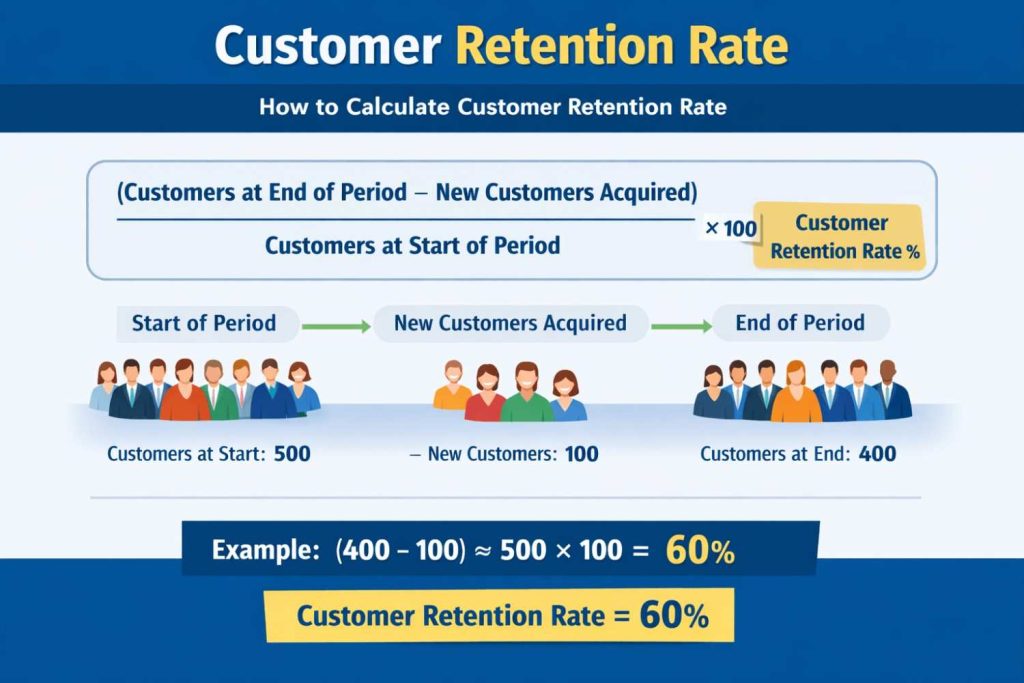
1. Customer Retention Rate
Customer Retention Rate shows the percentage of customers who continue doing business with you over a specific time period. It answers one simple question: how many customers stayed.
Unlike revenue metrics, Customer Retention Rate answers a behavioral question. Did customers stay or leave after their first interaction? This makes it essential for understanding product value, service quality, and overall experience consistency.
Customer Retention Rate formula
Customer Retention Rate =
(Customers at end of period − New customers acquired during period) ÷ Customers at start of period × 100
How to choose the right time period
- Monthly works best for SaaS and subscriptions
- Quarterly works better for ecommerce and retail
- Annual retention suits long purchase cycles
Using the wrong period leads to misleading conclusions, even with correct math.
What Customer Retention Rate tells you
- Whether customers see ongoing value
- Whether onboarding and early experience work
- Whether customers form repeat habits
What it does not tell you
- Which customers generate the most revenue
- Why customers leave
- When churn risk begins
Important note: A stable retention rate can still hide serious problems. If low value customers stay while high value customers leave, retention looks healthy while revenue weakens. This is why retention rate must always be paired with revenue retention and churn metrics.
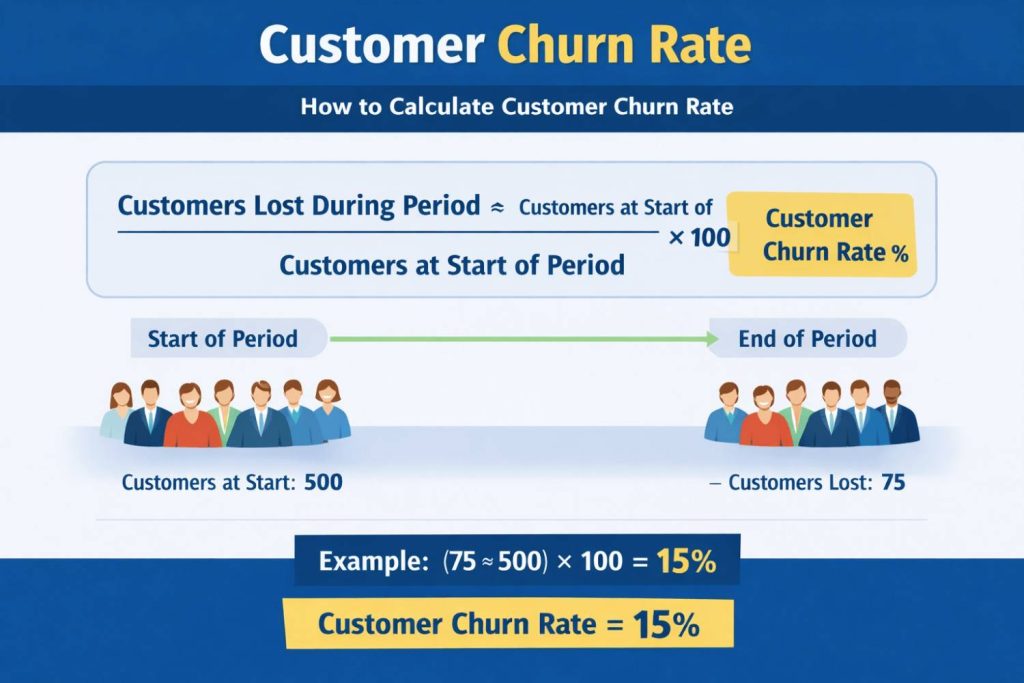
2. Customer Churn Rate
Customer churn rate measures the percentage of customers who stop doing business with you during a specific period. It shows loss, not growth, and that makes it one of the most honest retention metrics you can track.
Churn rate complements Customer Retention Rate. Retention shows who stayed. Churn shows who left. You need both to understand customer behavior clearly.
Customer Churn Rate formula
Customer Churn Rate =
Customers lost during period ÷ Customers at start of period × 100
This formula works best when you use a fixed time window. Monthly churn fits subscription and SaaS businesses. Quarterly churn works better for ecommerce and services with longer buying cycles.
What Customer Churn Rate tells you
- Whether customers find enough value to continue
- Whether pricing, onboarding, or support cause drop offs
- Whether recent changes hurt customer experience
What Customer Churn Rate does not tell you
- Which customers matter most for revenue
- When customers started disengaging
- What actions caused churn
Note: Churn does not start at cancellation. It starts earlier with reduced usage, longer gaps between purchases, or declining engagement. By the time churn appears, the opportunity to fix the problem has already passed.
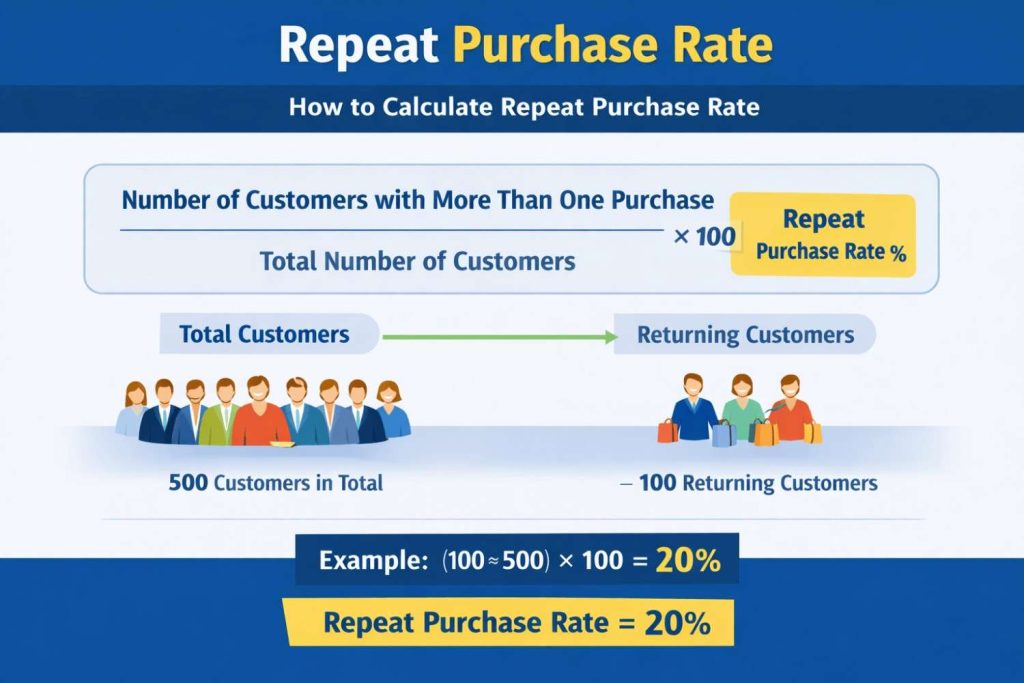
3. Repeat Purchase Rate
Repeat Purchase Rate measures how many customers come back to buy again after their first purchase. It shows habit formation. If customers return without heavy incentives, your value proposition works.
This metric matters most for ecommerce, retail, and non subscription businesses. When customers do not have contracts, repeat behavior becomes the clearest signal of retention. A rising Repeat Purchase Rate means customers trust your brand enough to choose it again.
Repeat Purchase Rate formula
Repeat Purchase Rate =
Number of customers with more than one purchase ÷ Total number of customers × 100
What Repeat Purchase Rate tells you
- Whether first time buyers convert into returning customers
- Whether product quality and fulfillment meet expectations
- Whether post purchase experience encourages another visit
What it does not tell you
- How frequently customers return after the second purchase
- How much revenue repeat customers generate
- Whether high value customers are returning or only low spenders
A high Repeat Purchase Rate does not always mean strong retention. If customers return once for a discount and never come back, the metric still looks healthy. This is why Repeat Purchase Rate must be paired with Time Between Purchases and Customer Lifetime Value.
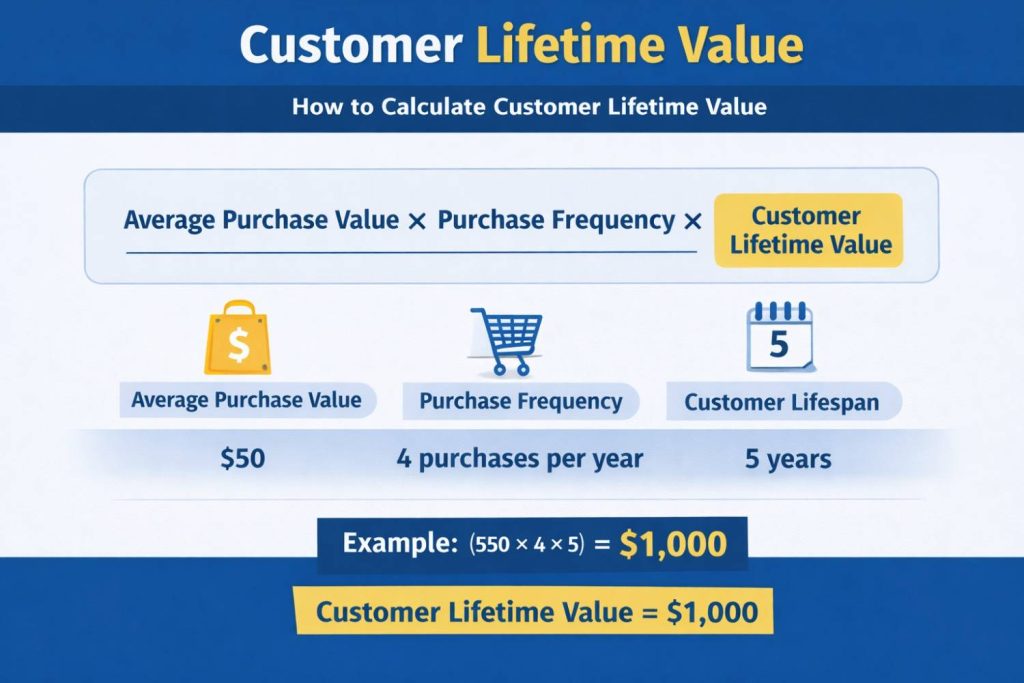
4. Customer Lifetime Value
Customer Lifetime Value measures the total revenue a customer generates over the entire relationship with your business. This metric answers one critical question: How much is a retained customer actually worth?
Customer Lifetime Value connects three behaviors into one number. How often customers buy, how much they spend, and how long they stay. Because it blends retention and revenue, it provides a clearer picture of sustainable growth than retention rate alone.
Customer Lifetime Value formula
Customer Lifetime Value =
Average purchase value × Purchase frequency × Customer lifespan
Some businesses simplify this formula, while others expand it to include margins and servicing costs. The version you choose should match how detailed your data is and how decisions get made internally.
What Customer Lifetime Value tells you
- Which customers deserve retention investment
- Whether loyalty efforts increase long term revenue
- Whether acquisition costs make sense
What it does not tell you
- When churn risk begins
- Why customers leave
- How experience issues affect behavior
A business can improve retention rate and still reduce Customer Lifetime Value. This happens when customers stay longer but spend less each time.
5. Time Between Purchases
Time Between Purchases measures the average gap between two consecutive purchases made by the same customer. It shows buying rhythm, not just loyalty. This metric often reveals retention issues earlier than churn or retention rate.
Customers rarely leave suddenly. They start buying less often. Gaps grow longer before churn appears. Time Between Purchases captures this slowdown while customers still exist in your system.
Time Between Purchases formula
Time Between Purchases =
Total time between all repeat purchases ÷ Number of repeat purchases
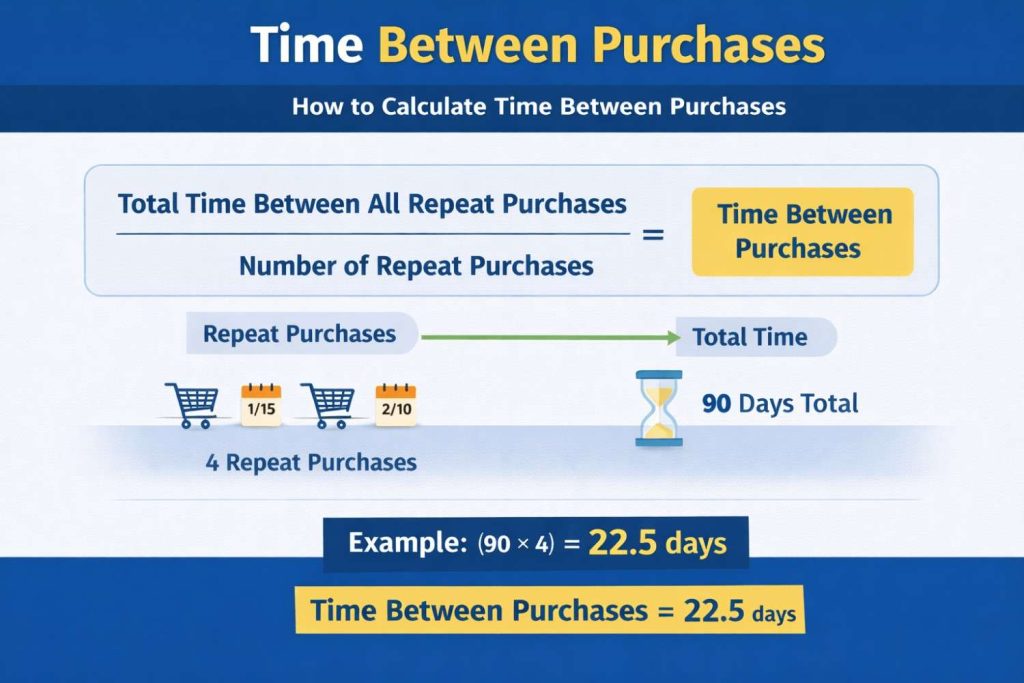
You calculate this per customer, then average it across a cohort or segment. Ecommerce businesses often measure this in days. B2B and services usually track it in weeks or months.
What Time Between Purchases tells you
- Whether customers are forming a buying habit
- Whether demand for your product stays consistent
- Whether post purchase engagement works
What it does not tell you
- Whether customers will return again
- How much customers spend when they return
- Which customers are most valuable
Retention can look stable while Time Between Purchases quietly increases. Customers still return, but less often. Revenue slows before churn appears. If you wait for churn data, you react too late.
Revenue Based Customer Retention Metrics
Customer counts alone do not show business health. Revenue based customer retention metrics reveal how much money you actually keep from existing customers over time. These metrics matter most when customer value varies widely, which is common in ecommerce, SaaS, and B2B.
This section shifts the focus from who stayed to how much value stayed.
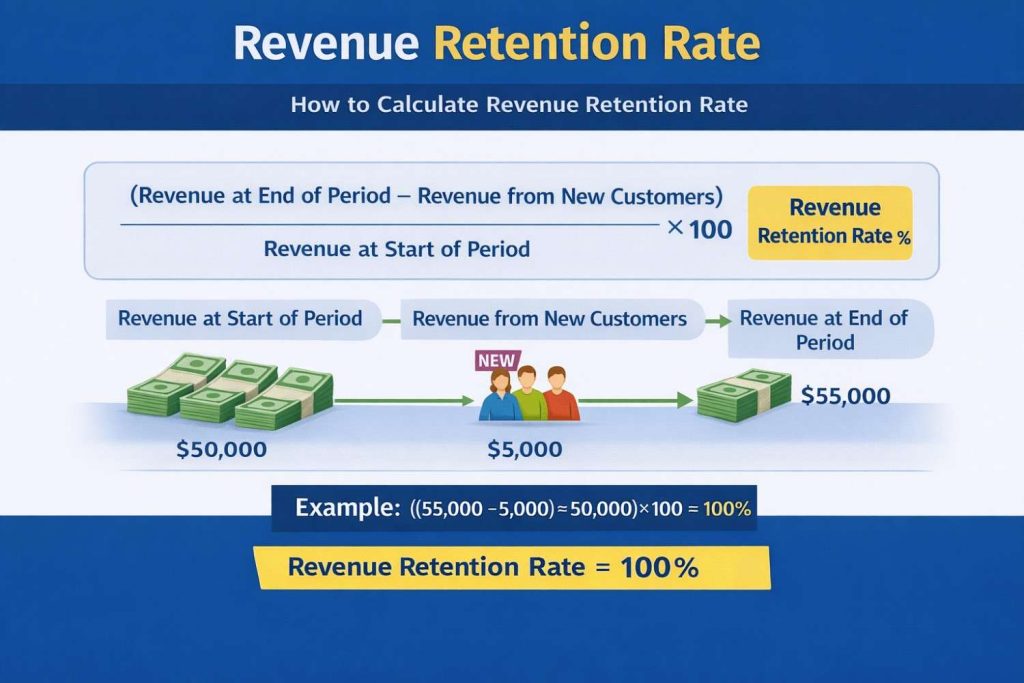
6. Revenue Retention Rate
Revenue Retention Rate measures how much recurring or repeat revenue you retain from existing customers during a period, excluding new customer revenue. It answers a critical question. Are your retained customers still worth the same or more.
A business can retain many customers and still lose revenue if high value customers downgrade, reduce spend, or leave. Revenue Retention Rate exposes this gap immediately.
Revenue Retention Rate formula
Revenue Retention Rate =
(Revenue at end of period − Revenue from new customers) ÷ Revenue at start of period × 100
What Revenue Retention Rate tells you
- Whether existing customers maintain spending levels
- Whether pricing, plans, or product value hold up
- Whether upsells and expansions offset churn
What it does not tell you
- How many customers stayed
- Which customers reduced spending
- Why revenue changed
Retention can look healthy while revenue retention drops. This means customers stay but spend less. When this happens, growth slows quietly before anyone notices.
7. Revenue Churn Rate
Revenue Churn Rate measures how much recurring or repeat revenue you lose from existing customers during a period. It focuses on money lost, not customers lost. This makes it more precise than customer churn when customer spending varies.
A business can lose very few customers and still suffer high revenue churn. This happens when high spending customers downgrade, reduce usage, or leave. Revenue Churn Rate exposes this risk immediately.
Revenue Churn Rate formula
Revenue Churn Rate =
Revenue lost from existing customers ÷ Revenue at start of period × 100
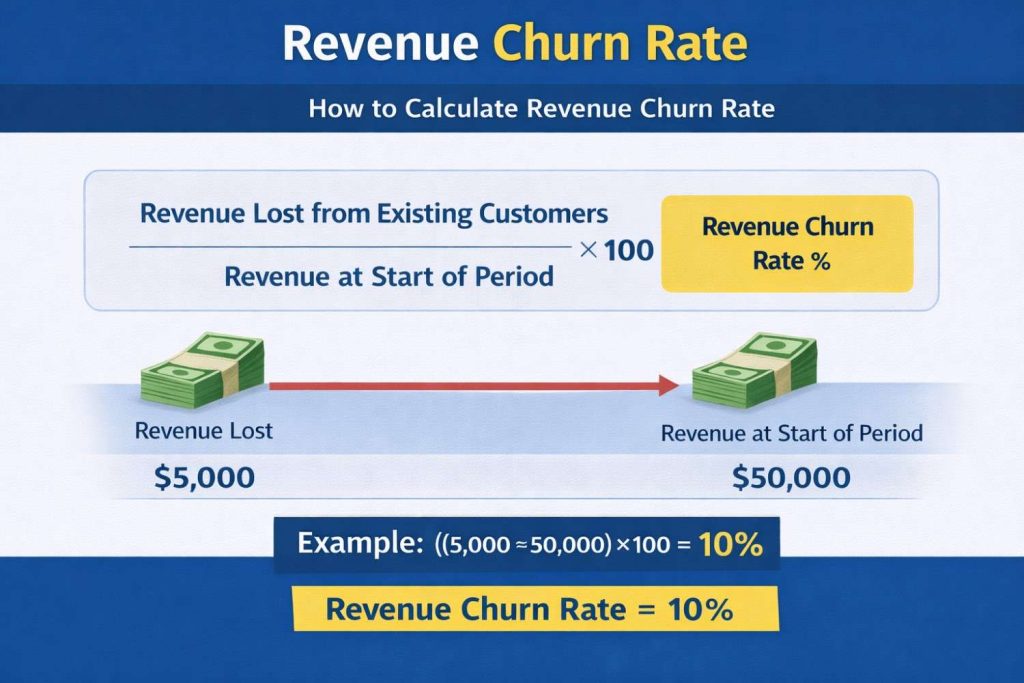
You should calculate this using only revenue from existing customers. New customer revenue must stay excluded. Including it hides real revenue loss and gives false confidence.
What Revenue Churn Rate tells you
- Whether retained customers reduce spending
- Whether downgrades hurt growth
- Whether pricing or value perception changes
What it does not tell you
- How many customers churned
- Which customers left entirely
- When disengagement started
Here is an important insight most teams miss. Revenue churn often rises before customer churn. Customers usually reduce spending before they leave completely. If you track only customer churn, you react late.
8. Average Revenue Per User
Average Revenue Per User shows how much revenue each customer generates on average during a specific period. It helps you understand the quality of your retained customers, not just how many stay.
This metric matters when customer spending varies. Two businesses can have the same retention rate, but very different revenue outcomes. Average Revenue Per User exposes whether retained customers spend more, less, or the same over time.
Average Revenue Per User formula
Average Revenue Per User =
Total revenue during period ÷ Total number of active customers during period
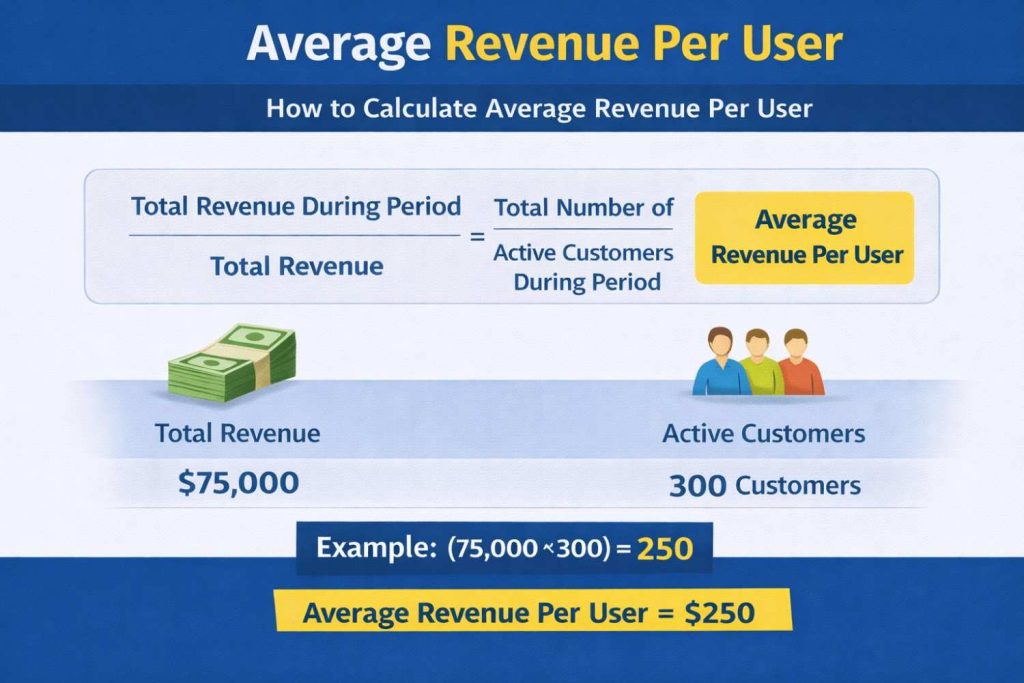
You should calculate this using only active customers in that time window. Including inactive or churned customers distorts the result and hides real performance.
What Average Revenue Per User tells you
- Whether retained customers increase or reduce spending
- Whether pricing and packaging work
- Whether upsells and cross sells succeed
What it does not tell you
- How long customers stay
- When customers plan to leave
- How often customers buy
Average Revenue Per User can rise even while retention drops. This usually happens when low spending customers leave first. Revenue looks healthier, but the customer base shrinks. Without retention metrics alongside ARPU, this trend looks positive when it is not.
Behavioral and Experience Based Retention Metrics
Behavioral and experience based retention metrics focus on how customers feel and behave before they churn. These metrics do not measure loss directly. They measure signals that appear earlier, when customers are still active but starting to disengage.
Most churn does not happen suddenly. Customers reduce usage, feel friction, or lose trust long before they leave. Behavioral and experience metrics help you spot these changes early and act before revenue drops.
In this section, we look at the most important experience driven retention metrics and how to use them correctly.
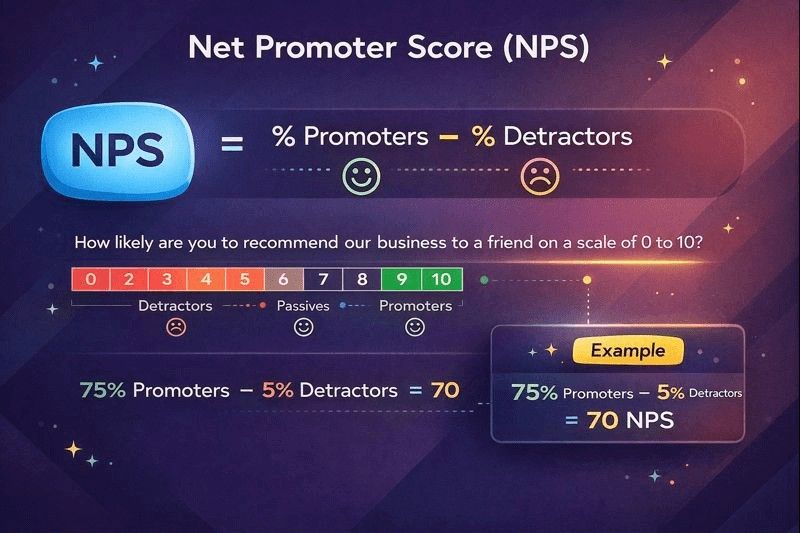
9. Net Promoter Score
Net Promoter Score measures how likely customers are to recommend your business to others. It captures loyalty at an emotional level, not transactional behavior. Customers answer one question about recommendation intent, which turns sentiment into a numeric score.
Net Promoter Score groups customers into promoters, passives, and detractors. Promoters signal strong loyalty. Detractors signal dissatisfaction and churn risk. The score reflects the balance between these two groups.
Net Promoter Score formula
Net Promoter Score =
Percentage of promoters − Percentage of detractors
What Net Promoter Score tells you
- Whether customers feel positive about your brand
- Whether trust and satisfaction exist beyond purchases
- Whether word of mouth growth is likely
What it does not tell you
- Whether customers will actually repurchase
- How much revenue customers generate
- When customers will churn
Here is an important insight many teams miss. A high Net Promoter Score does not guarantee strong retention. Customers can recommend a product and still reduce usage or spending. NPS reflects perception, not behavior.
10. Customer Satisfaction Score (CSAT)
Customer Satisfaction Score measures how satisfied your customers feel after a specific interaction, not over a long relationship. CSAT focuses on immediate experience quality. It tells you if a product, support response, delivery, or feature met expectations in that moment.
Most businesses use CSAT after support tickets, onboarding steps, feature launches, or post purchase moments. This makes CSAT one of the fastest feedback loops among all customer retention metrics.
What CSAT measures exactly
CSAT tracks perceived satisfaction, not loyalty or intent. A customer can feel satisfied today and still churn later. That makes CSAT a diagnostic metric, not a prediction metric.
CSAT answers one simple question:
Did this interaction meet the customer’s expectations?
Common CSAT question format
- How satisfied were you with your experience today?
- How satisfied are you with this support interaction?
- How satisfied are you with this purchase?
Customers usually respond on a 1–5 scale or 1–7 scale, where higher numbers mean higher satisfaction.
CSAT formula
Customer Satisfaction Score is calculated as:
CSAT = (Number of satisfied responses ÷ Total responses) × 100
Only high scores count as satisfied. Most teams treat 4 and 5 as satisfied responses on a 5 point scale.
Example calculation
- Total survey responses: 200
- Responses rated 4 or 5: 160
CSAT = (160 ÷ 200) × 100 = 80%
This means 80% of customers felt satisfied with that interaction.
Increase your ROI upto 20X with WPLoyalty’s customized loyalty campaigns and reward your loyal customers this Valentine’s day.
Conclusion: How to Use Customer Retention Metrics the Right Way
Customer retention metrics only create value when you use them together, not in isolation. No single metric explains why customers stay, spend, or leave. Retention becomes clear when behavior, revenue, and experience metrics connect.
Core metrics like Customer Retention Rate and Churn Rate show who stayed and who left. Revenue based metrics reveal how much value stayed. Behavioral and experience metrics explain why customers act the way they do. Each layer answers a different question.
Strong retention teams focus on early signals, not just outcomes. Time Between Purchases, CSAT, and NPS expose friction before churn appears. Revenue metrics show whether loyalty turns into growth. Ignoring early signals leads to delayed reactions and lost revenue.

